The Gender Equality Index is a composite indicator that measures the distance a society has to go to achieve full equality among women and men.
This indicator's objective is to reflect the reality of gender equality in important aspects of welfare and people's development.
Idescat produces the IIG for Catalonia in accordance with the methodology established by the European Institute for Gender Equality (EIGE).
The Index is based on 31 indicators, structured in a hierarchical manner in 6 domains, which are then divided into 14 sub-domains. The results offered are of 4 types:
- The Gender Equality Index (maximum aggregation level).
- The index for each of the 6 domains of the analysis: work, money, knowledge, time, power and health.
- The index for each of the 14 sub-domains in which the 6 aforementioned domains are broken down.
- 31 basic indicators, which are the basis for calculating the aforementioned levels.
The results of the Gender Equality Index and its component parts (domains and sub-domains) are presented on a dimensionless scale, in an interval that goes from 1 to 100, where 1 means total inequality and 100 means total equality.
The results of the 31 basic indicators are shown by the total population, disaggregated by gender, and by the absolute difference between women and men. Each indicator has its own metric.
The results of the indices for Catalonia are disseminated for the years 2005, 2010, 2012, 2015 and annually since 2017, in accordance with the periodicity used by the European Institute for Gender Equality to disseminate the results of the European Union and its member states.
The results of the IGG for 2019 have been published in March 2022 and the statistical series available since 2005 have been revised with the incorporation of new sources or improvements in the definition of the following indicators: share in regional assemblies, share in the management of the main companies listed on the stock market, share of board members of research funding organisations and share of members of highest decision making body of the national Olympic sport organisations. With regard to EU data, the statistical information available since 2010 has been replaced with the new composition of the EU after Brexit (EU-27), as reflected in the EIGE with the data published for that period.
1. Definitions
- Work
-
Domain that measures the conditions under which women and men may benefit equal access to employment and good working conditions. It encompasses 2 sub-domains:
Participation. Sub-domain that combines 2 indicators to measure the degree of participation of women and men in the labour market.
- Full-time equivalent employment rate. Percentage of the population in full-time equivalent employment. From 2021, employed population from 16 to 89 years is considered (before 2021 population aged 16 years and over was considered). Full-time equivalent jobs are defined as the total number of hours worked divided by the mean annual hours worked in full time jobs.
- Duration of working life. Number of years that a generation expects to be active in the conditions of activity and mortality of the baseline year.
Segregation and quality of work. Sub-domain that combines 3 indicators: the level of segregation per gender of the occupation, the flexibility of working patterns to achieve work-life balance, and career prospects.
- Employed people in education, human health and social work activities. Percentage of employment in these sectors (divisions 85-88 of the CCAE-2009) with respect to the employed population from 16 to 89 years (before 2021 population aged 16 years and over was considered).
- Ability to take one hour or two off during working hours to take care of personal or family matters: Percentage of the population in employment that state they can leave their workplace for at least one hour for family or personal reasons, without having to request special leave.
- Career Prospects Index. Likelihood of promotion within the company or organisation, measured on a scale of 0 to 100.
- Money
-
Domain that measures the gender inequalities in access to financial resources and in the economic situation. It encompasses 2 sub-domains:
Financial resources. Sub-domain that combines 2 indicators: pay and income. The results are expressed in terms of purchasing power parity to make the information comparable among the different countries.
- Mean monthly earnings. Mean net monthly income in purchasing power parity of employed and similar people employed in the sectors of industry, construction and services, in companies with 10 or more workers. (sections B-S, except for O, from the CCAE-2009)
- Mean equivalised net income. Net equivalent mean annual income (or by consumption unit) in purchasing power parity of the population aged 16 years or over. Includes pensions, investments, benefits and any other source of income, as well as earnings from remunerated work, and from this are deducted taxes, social insurance contributions and transfers made between households. To better compare the income of the different types of households, the concept of the consumption unit is used internationally. Each household's number of consumption units is calculated using the amended OECD's equivalence scale, which converts the number of members resident in a household into the number of consumption units, and imputs a weighting of 1 to the first adult, 0.5 to the rest of the adults and 0.3 to minors under the age of 14. The income per consumption unit is obtained by dividing the total net income of the household by the number of consumption units.
Economic situation. Sub-domain that combines 2 indicators: the risk of poverty and the distribution of women and men's income.
- Not at-risk-of-poverty. People with an income equal to or greater than 60% of the mean average of the net income per consumption unit of the population aged 16 years or over.
- Income distribution S20/S80. Ratio between the total income received by the 20% of the population with the lowest incomes (the 20th quintile) and the 20% of the population with the highest incomes (80th quintile). This is the inverse version of the indicator S80/S20.
- Knowledge
-
Domain that measures gender inequalities in access to higher education and continuous training, and segregation according to field of study. It encompasses 2 sub-domains:
Attainment and participation. Sub-domain that combines 2 indicators of studies completed and studies in progress of women and men.
- Graduates of tertiary education. Percentage of the population with a higher education diploma or degree (categories 5, 6, 7 and 8 of the CCE-2019). From 2021, population from 15 to 89 years is considered (before 2021 population aged 16 years and over was considered).
- People participating in formal or non-formal education. Percentage of the population who participate in formal or informal educational activities. From 2021, population from 15 to 74 years is considered (before 2021 population aged 15 years and over was considered).
Segregation. Sub-domains that includes a thematic bias indicator according to the gender of the higher studies chosen.
- Tertiary students in education, health and welfare, humanities and arts. Percentage of students in those sectors of study (sectors 01, 02 and 09 of the CCE-2019), in relation to the total of higher education students.
- Time
-
Domain that measures gender inequalities in non-remunerated work caring for people and domestic tasks, as well as dedication to social activities. It encompasses 2 sub-domains:
Care activities. Sub-domain that includes an indicator on the care of people and another indicator on housework.
- People caring for and educating their children or grandchildren, elderly or people with disabilities. Percentage of the population who habitually care for infants, grandchildren, the elderly or people with some form of disability without remuneration. From 2021, population from 18 to 74 years is considered (before 2021 population aged 18 years and over was considered).
- People doing cooking and/or housework. Percentage of the population who habitually do cooking and housework, without receiving remuneration. From 2021, population from 18 to 74 years is considered (before 2021 population aged 18 years and over was considered).
Social activities. Sub-domain that includes an indicator of participation in leisure activities and another indicator of dedication to voluntary activities.
- Workers doing sporting, cultural or leisure activities outside of their home. Percentage of workers that play sport, engage in cultural or leisure activities outside the home, every day or several times a month.
- Workers involved in voluntary or charitable activities. Percentage of workers involved in voluntary or charitable activities, at least once a month.
- Power
-
Domain that measures gender inequalities in the exercise of political representation and presence in governing boards of the main economic and social bodies. It encompasses 3 sub-domains:
Political power. Sub-domain that includes 3 indicators of political representation, from the national to the regional government level.
- Share of ministers. Percentage of female and male ministers in the Government of Catalonia.
- Share of members of parliament. Percentage of female and male members of the Catalan Parliament.
- Share of members of regional assemblies. Percentage of female and male members of local councils.
Economic power. Sub-domain that includes indicators of participation in the management of the main companies listed on the stock market and public financial bodies.
- Share of members of boards in largest quoted companies. Percentage of male and female directors of boards of the leading listed companies.
- Share of board members of central bank. Percentage of women and men on the Board of Governors of the Catalan Institute of Finances.
Social power. Sub-domain that includes indicators of the share in the management of research-funding bodies, public communications media and the main sports federations.
- Share of board members of research funding organisations. Percentage of women and men in the governing bodies of the main research-funding institutions.
- Share of board members of publicly owned broadcasting organisations. Percentage of women and men on the Board of Governors of the Catalan Corporation of Audio-Visual Media.
- Share of members of highest decision making body of sporting federations. Percentage of women and men on the governing boards of sporting federations.
- Health
-
Domain that measures gender inequalities in the real or perceived state of health, behaviour and access to healthcare. It encompasses 3 sub-domains:
Status. Sub-domain that includes 3 health indicators, both real and perceived.
- Self-perceived health, good or very good. Percentage of the population aged 16 or over who perceive their state of health to be good or very good.
- Life expectancy at birth. Number of years of healthy life expectancy at birth.
- Healthy life years at birth. Number of years of healthy life expectancy at birth.
Behaviour. Sub-domain that includes indicators of the population's healthy life habits.
- People who don't smoke and are not involved in harmful drinking. Percentage of the population aged 16 or over who neither smoke nor drink in a harmful manner.
- People doing physical activities and/or consuming fruits and vegetables. Percentage of the population aged 16 or over who do intense physical exercise and/or consume a sufficient amount of fruit and vegetables.
Access. Sub-domain that includes indicators of healthcare coverage.
- Population without unmet needs for medical examination. Percentage of the population aged 16 or over who report that they have received medical attention when they needed it.
- Population without unmet needs for dental examination. Percentage of the population aged 16 or over who report that they have received dental attention when they needed it.
2. Calculation method
The gender equality index is constructed in an ascending manner by the aggregation of 31 basic indicators. Each of these indicators is converted into a measure of equality, which is constructed on the basis of the gender gap of the indicator, weighted by a level factor. The aggregation procedures consecutively obtain the 14 sub-domains, the 6 domains and, finally, the gender equality index.
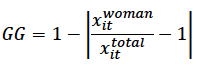
2.1. Metric to define gender equality by indicator
For each of the 31 indicators, the Gender Gap (GG) is calculated from the ratio between the value of women and the total value of the basic indicator "i" in question with regard to the year "t" (Xit), converted into a scale from 0 to 1.
The gender equality Measure (M) for each basic indicator (Xit) is obtained from the Gender Gap (GG) , which is corrected by means of a level factor and is converted into a scale that goes from the value 1 to the value 100.
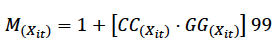
The Correcting Coeficient is applied to take into account the degree of achievement in an indicator,
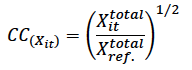
where Xref. is a reference value that the European Institute for Gender Equality has established as the maximum value achieved for a variable X in any of the 28 countries of the European Union and in any of the years 2005, 2010, 2012 and 2015. This level factor is not applied to the indicators of the Power domain nor to the indicators care and housework of the Time domain.
2.2. Aggregation method
The process of aggregation that leads to the calculation of the gender equality index is conducted in a stepwise manner in ascending order from the basic indicators to the gender equality index.
The synthetic indices for the 14 sub-domains (S) are obtained by calculating the simple arithmetic mean of the gender equality measure (M) of each basic indicator (Xit):
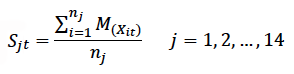
where:
nj is the number of indicators included in each sub-domain
Sjt is the synthetic index for each sub-domain and year
The synthetic indices for the 6 domains (D) are obtained by calculating the geometric mean of the corresponding sub-domains (S):
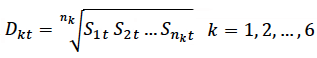
where:
nk is the number of sub-domains included in each domain
Dkt is the synthetic indicator for each domain and moment of time
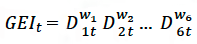
The Gender Equality Index (GEI) is obtained by calculating the weighted product of the synthetic indices of the 6 domains (D):
2.3. Weighting
The weights applied have been calculated by the European Institute for Gender Equality by applying the hierarchical analysis methodology. The weights of each of the domains are as follows:
| Work | 0.19 |
|---|---|
| Money | 0.15 |
| Knowledge | 0.22 |
| Time | 0.15 |
| Power | 0.19 |
| Health | 0.10 |
2.4. Imputation of missing values
The calculation of the Gender Equality Index requires that all 31 indicators are available in full for each of the reference years. If the indicator is not available, it has been imputed the time value closest to the available series and is indicated with the symbol of estimated data (and) of the tabulation.
3. Quality of the indicators
For each of the 31 indicators, different quality aspects have been assessed. Firstly, the level of harmonisation with the original indicator of the European Institute for Gender Equality with regard to the item measured (2 equivalent, 1 approximation), the source used (2 same source, 1 different source), the comparability and availability of the temporal data (2 full, 1 series break and/or partial data).
| No. | Indicator | Item measured | Source | Available serie | Score |
|---|---|---|---|---|---|
| 1 | Full-time equivalent employment rate | 2 | 2 | 2 | 6 |
| 2 | Duration of working life | 2 | 2 | 2 | 6 |
| 3 | Employed people in education, human health and social work activities | 2 | 2 | 2 | 6 |
| 4 | Ability to take one hour or two off during working hours to take care of personal or family matters | 2 | 2 | 1 | 5 |
| 5 | Career Prospects Index | 2 | 2 | 1 | 5 |
| 6 | Mean monthly earnings | 2 | 2 | 1 | 5 |
| 7 | Mean equivalised net income | 2 | 2 | 2 | 6 |
| 8 | Not at-risk-of-poverty | 2 | 2 | 2 | 6 |
| 9 | Income distribution S20/S80 | 2 | 2 | 2 | 6 |
| 10 | Graduates of tertiary education | 2 | 2 | 2 | 6 |
| 11 | People participating in formal or non-formal education | 2 | 2 | 2 | 6 |
| 12 | Tertiary students in education, health and welfare, humanities and arts | 2 | 1 | 1 | 4 |
| 13 | People caring for and educating their children or grandchildren, elderly or people with disabilities | 1 | 1 | 1 | 3 |
| 14 | People doing cooking and/or housework | 1 | 1 | 1 | 3 |
| 15 | Workers doing sporting, cultural or leisure activities outside of their home | 1 | 1 | 1 | 3 |
| 16 | Workers involved in voluntary or charitable activities | 2 | 1 | 1 | 4 |
| 17 | Share of ministers | 2 | 2 | 2 | 6 |
| 18 | Share of members of parliament | 2 | 2 | 2 | 6 |
| 19 | Share of members of regional assemblies | 2 | 2 | 2 | 6 |
| 20 | Share of members of boards in largest quoted companies | 2 | 2 | 2 | 6 |
| 21 | Share of board members of central bank | 1 | 2 | 2 | 5 |
| 22 | Share of board members of research funding organisations | 2 | 2 | 2 | 6 |
| 23 | Share of board members of publically owned broadcasting organisations | 2 | 2 | 2 | 6 |
| 24 | Share of members of highest decision making body of the national Olympic sport organisations | 1 | 2 | 2 | 5 |
| 25 | Self-perceived health, good or very good | 2 | 2 | 2 | 6 |
| 26 | Life expectancy at birth | 2 | 2 | 2 | 6 |
| 27 | Healthy life years at birth | 2 | 1 | 2 | 5 |
| 28 | People who don't smoke and are not involved in harmful drinking | 2 | 1 | 2 | 5 |
| 29 | People doing physical activities and/or consuming fruits and vegetables | 1 | 1 | 1 | 3 |
| 30 | Population without unmet needs for medical examination | 2 | 2 | 2 | 6 |
| 31 | Population without unmet needs for dental examination | 2 | 2 | 2 | 6 |