Small area socioeconomic index. 2020
In 2020, the municipalities with more than 500 inhabitants in Catalonia with the highest territorial socioeconomic index (IST) were Matadepera (131.8), Castellolí (125.8) and Sant Cugat del Vallès (124.9). At the other extreme, Barbens (57.1), Salt (62.0) and Seròs (65.1) were the municipalities with the lowest socio-economic index.
Idescat expands the territorial detail of the territorial socioeconomic index (IST) and or the first time offers data for all the municipalities and all the census tracts in Catalonia. The IST is a synthetic index for small areas that summarises in a single value various socioeconomic characteristics of the population and quantifies the differences within Catalonia and its municipalities.
There are important differences in the socioeconomic level of Catalan municipalities: 37 municipalities had a high IST (more than 20 percentage points higher than the Catalan average). Of these, 12 were in the Metropolitan Area, 10 in the Central Counties area and 6 in L'Alt Pirineu i Aran area. The largest group, made up of 527 municipalities, was in the medium-high level of the IST (between the Catalan average and 20 percentage points above it) and was distributed throughout Catalonia, except in Les Terres de l'Ebre area. There are 352 municipalities that had a medium-low IST (between the Catalan average and 20 points below it). Most of the municipalities of Les Terres de l'Ebre were in this group. Finally, out of the 31 municipalities with the lowest socioeconomic level, 16 were in the Ponent area and 9 in the Girona Counties area.
The IST concentrates in a single value the information of 6 indicators: 2 of employment situation, 2 of educational level, 1 of immigration and 1 of income.
Among the municipalities with more than 500 inhabitants, those with the highest and lowest values for each component were the following:
- Employed population aged 20 to 64 (64.0% for Catalonia as a whole). This indicator shows the highest value in Vila-sana (81.1%) and the lowest in Talarn (30.7%).
- Low-skilled workers (11.8% in Catalonia as a whole). The municipality with the lowest value was Matadepera (2.6%), and the one with the highest was Sant Pere Pescador (35.2%).
- Population aged 20 years and over with low education levels (14.0% for Catalonia as a whole). The municipality with the lowest value was Lladó (3.3%), and the highest value was in La Fatarella (33.0%).
- Young population without post-compulsory education (26.6% compared to Catalonia as a whole). This indicator shows the greatest inequality between municipalities. The municipality with the lowest value was Matadepera (5.4%), and the highest was Torres de Segre (60.9%).
- Foreigners from low or middle-income countries (13.0% in Catalonia as a whole). The municipality with the lowest value was Castellolí (0.6%), and the highest was Guissona (51.8%).
- Average income per person (14,152 € for Catalonia as a whole). The municipality with the highest value was Matadepera (22,806 €), and the one with the lowest value was Salt (9,468 €).
The availability of inframunicipal data makes it possible to quantify socioeconomic differences within municipalities.
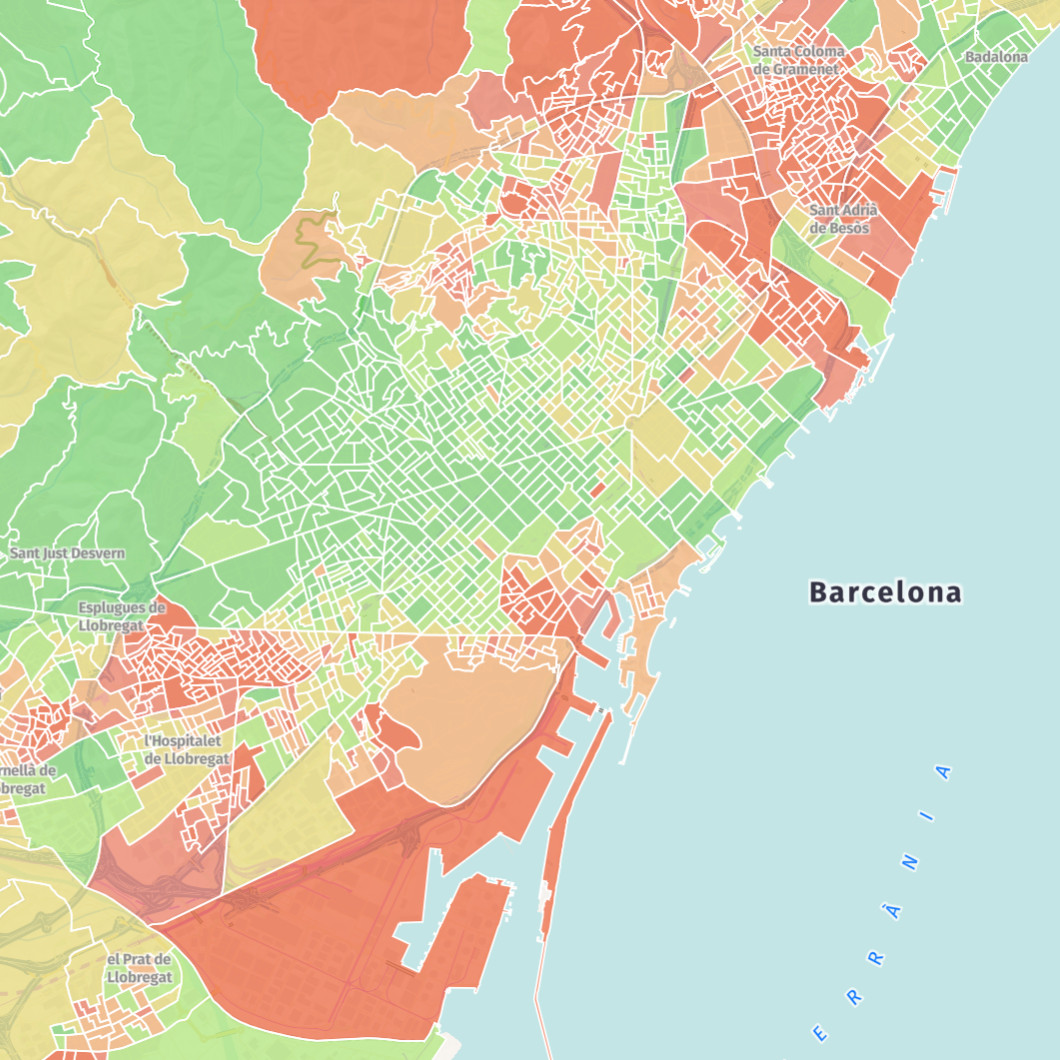
The results for the municipality of Barcelona are also presented for the 73 city’s neighbourhoods as defined by the City Council. Of these, 11 had an IST 20 percentage points lower than the Catalan average, including Ciutat Meridiana (66.1), El Besòs and El Maresme (72.4), and La Trinitat Vella (73.0). At the other extreme, there are 9 neighbourhoods with an IST that exceeded the Catalan average by more than 20 percentage points, including Les Tres Torres (135.9), Sant Gervasi-Galvany (131.3) and Pedralbes (129.6).
In 2020 there were 5,073 census tracts in Catalonia, of which 465 had an IST more than 20 percentage points above the Catalan average and, at the other extreme, 625 had an IST 20 points or more below the average. The 5 census tracts with the highest socioeconomic level were in the municipality of Barcelona, with an IST between 138.2 and 140.3, while the 5 census tracts with the lowest level were in Reus (32.1), Figueres (32.6), Salt (33.5), Tarragona (33.8) and Tortosa (33.8).
Regarding the 853 census tract groups, there are significant differences in the socioeconomic level of their inhabitants: 67 groups had an IST that was more than 20 percentage points higher than the Catalan average. Of these, 64 were in the Metropolitan Area and one in the Girona Counties area, one in El Camp de Tarragona area and one in El Penedès area. On the other hand, the 102 groups with the lowest socio-economic level were distributed throughout all the areas of the territorial plan (except in L'Alt Pirineu and Aran area).
The results by counties, municipalities, census tract groups and census tracts can be consulted through the new map viewer developed by the Cartographic and Geological Institute of Catalonia, in collaboration with Idescat.