Small Area Socioeconomic Index. 2022
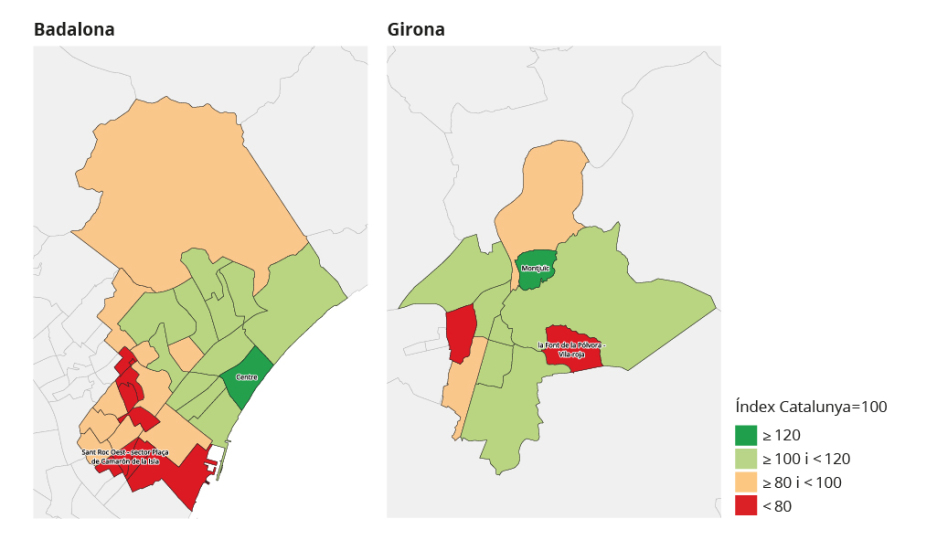
In 2022, the municipalities with the greatest differences in the Small Area Socioeconomic Index (IST) between their census tract groups were Girona and Badalona.
The IST is a relative index with a reference value for Catalonia of 100. It summarises various socioeconomic characteristics of the population residing in a territory and quantifies the differences between municipalities and within them.
The IST for Girona was 98.4, very close to the average for Catalonia (IST=100), but in the Girona 7 (Montjuïc) census tract group the IST was 127.8 while in Girona 2 (La Font de la Pólvora - Vila-roja) it was 51.4. There was therefore a difference of 76.4 points between these two census tract groups in the same municipality.
The IST for Badalona was 94.1, but in the Badalona 1 (Centre) census tract group it was 122.1 while in Badalona 9 (Sant Roc Oest - Plaça de Camarón de la Isla sector) it was 51.5, with a difference of 70.6 points between the two census tract groups.
Small Area Socioeconomic Index by census tract groups. 2022
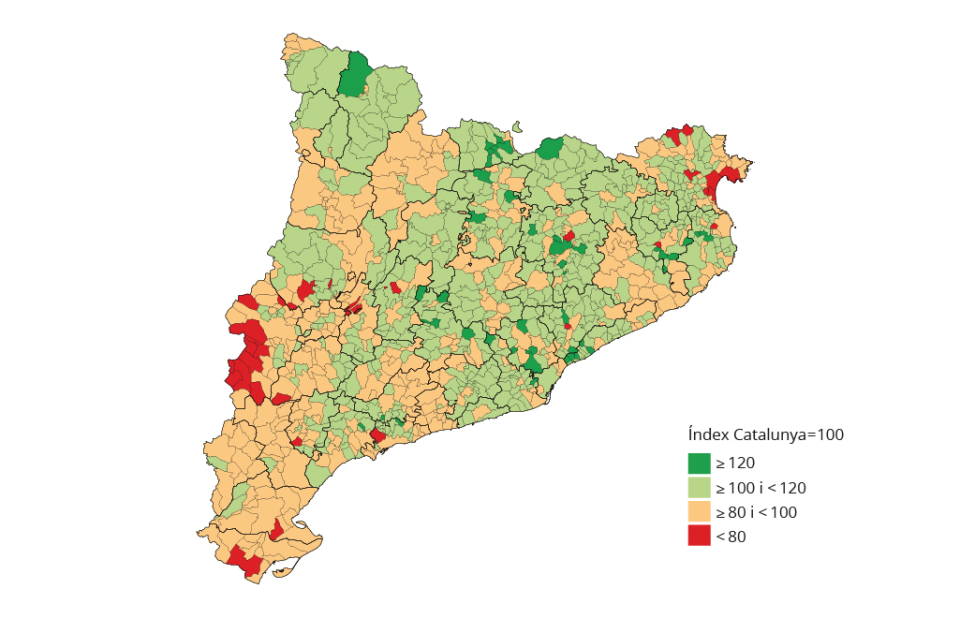
As for municipalities with more than 500 inhabitants, those with the highest small area socioeconomic index in 2022 were Matadepera (130.0), Castellolí (125.5) and Tiana (124.6). At the other end of the scale, the municipalities with the lowest socioeconomic index were Barbens (54.4), Salt (59.9) and Sant Pere Pescador (65.6).
There were significant differences in the socioeconomic level of the 947 Catalan municipalities: 44 municipalities had a high IST (more than 20 percentage points above the Catalan average) and, at the other end of the scale, 30 had a low IST (more than 20 points below the average). Meanwhile, the largest group of municipalities (517 municipalities) had a medium-high IST (between the Catalan average and 20 percentage points above it). Finally, there were 356 municipalities with a medium-low IST (between the Catalan average and 20 points below it).
Small Area Socioeconomic Index (IST) by Municipalities. Catalonia. 2022
The IST index brings together information from six indicators in a single value: two on employment situation, two on educational level, one on immigration status and one on income.
In terms of municipalities with more than 500 inhabitants, those with the highest and lowest values for each of the indicators were as follows:
- Employed population aged 20 to 64 (66.5% in Catalonia as a whole). This indicator showed the highest value in Les Masies de Roda (81.0%) and the lowest in Talarn (37.1%).
- Low-skilled workers (12.0% in Catalonia as a whole). The municipality with the lowest value was Matadepera (3.0%) and the one with the highest was Soses (39.1%).
- Population aged 20 or over with low educational level (14.3% in Catalonia as a whole). The municipality with the lowest value was Vallromanes (3.7%) and the one with the highest was La Fatarella (31.2%).
- Young population without post-compulsory education (24.0% in Catalonia as a whole). This indicator shows the greatest inequality between municipalities. The municipality with the lowest value was Fontanals de Cerdanya (1.1%) and the one with the highest was Barbens (56.1%).
- Foreigners from low- or middle-income countries (12.4% in Catalonia as a whole). The municipality with the lowest value was Guils de Cerdanya (0.5%) and the one with the highest was Guissona (52.3%).
- Average income per person (15,519 € in Catalonia as a whole). The municipality with the highest value was Matadepera (24,814 €) and the one with the lowest was Salt (10,242 €).
The results for the municipality of Barcelona are also presented for the city's 73 neighbourhoods as defined by the City Council. Of these, 10 had an IST which was more than 20 percentage points above the Catalan average, including Les Tres Torres (134.3), Sant Gervasi-Galvany (130.1) and Sarrià (129.0). At the other end of the scale, 10 neighbourhoods had an IST 20 percentage points lower than the Catalan average, including Ciutat Meridiana (66.5) and El Besòs i El Maresme (73.6).
The IST results are published at the inframunicipal level for 853 census tract groups, Barcelona's neighbourhoods and 5,091 census tracts in Catalonia. Results are also available by county and for all municipalities. This information can be viewed via the statistical data map viewer.